


INP Optimization in Web Vitals: Examples and Solutions.
Listen to the audio version of this article.
What is INP?
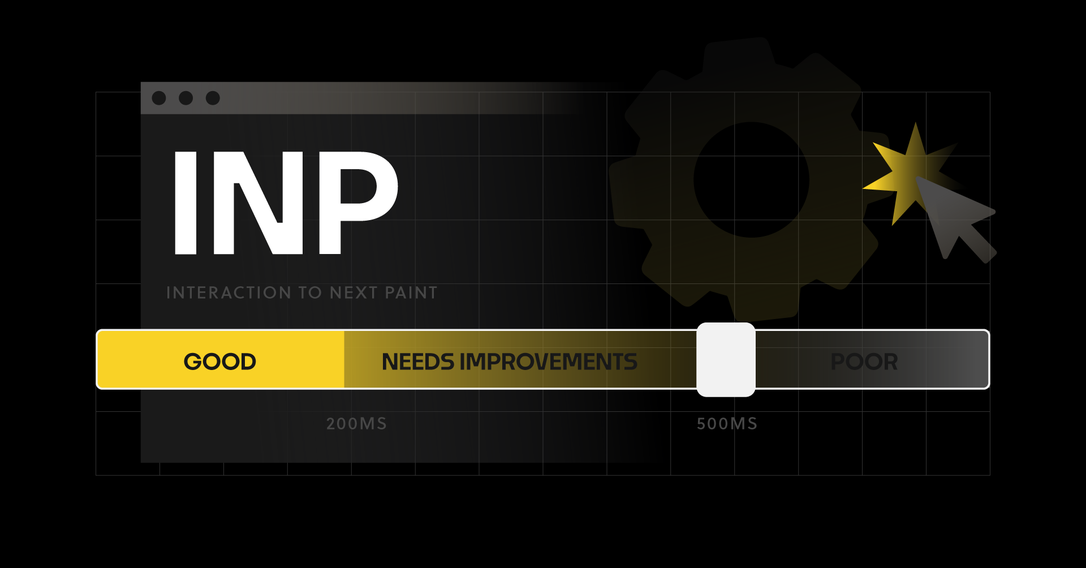
INP (Interaction to Next Paint) is one of the key performance indicators for websites, measuring how long it takes for a page to respond to a user interaction. More specifically, INP captures the time from when an interaction (such as a click or tap) begins until the browser repaints the next frame that reflects that interaction. This is an important parameter that evaluates how quickly a site responds to users' actions, which directly affects their comfort and satisfaction with the site.
How is INP measured?
INP is measured by monitoring all user interactions with a website. The process is as follows:
Zbieranie danych:
Narzędzia monitorujące, takie jak API Web Vitals, rejestrują czas trwania wszystkich interakcji na stronie. Obejmuje to kliknięcia, dotknięcia, a także inne formy interakcji z elementami strony.
Obliczenie INP:
Wartość INP jest definiowana jako najdłuższy czas reakcji zarejestrowany w trakcie sesji użytkownika. To oznacza, że raportowany wynik INP to najdłuższe opóźnienie, jakie napotkał użytkownik w trakcie korzystania ze strony.
Ocena wskaźnika:
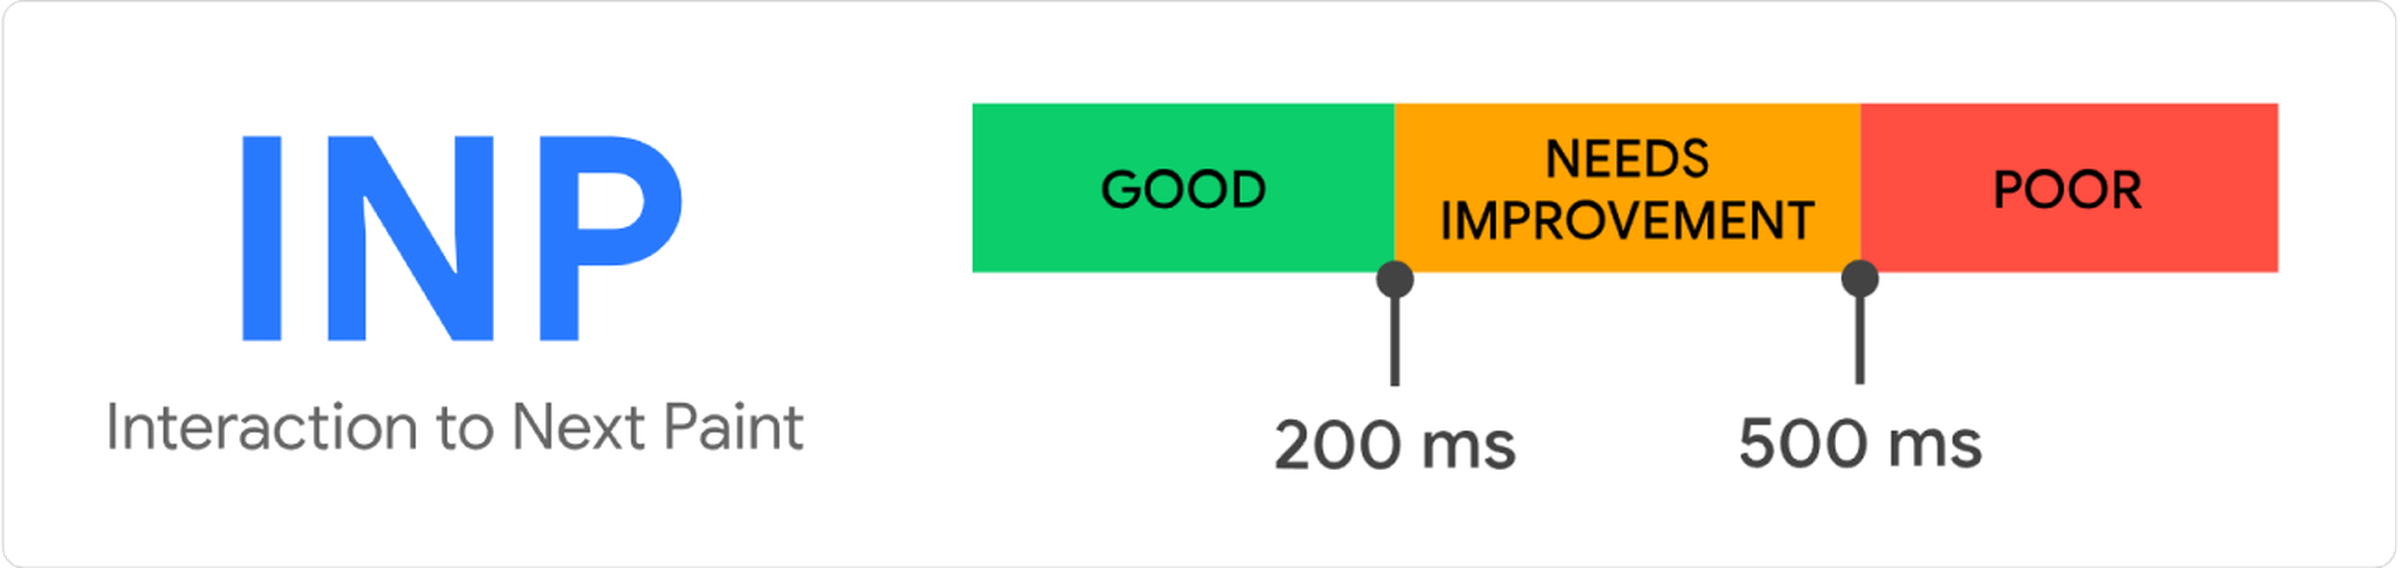
Dobry: ≤ 200 ms;
Zadowalający: między 200 ms a 500 ms;
Zły: > 500 ms.
What makes up the interaction?
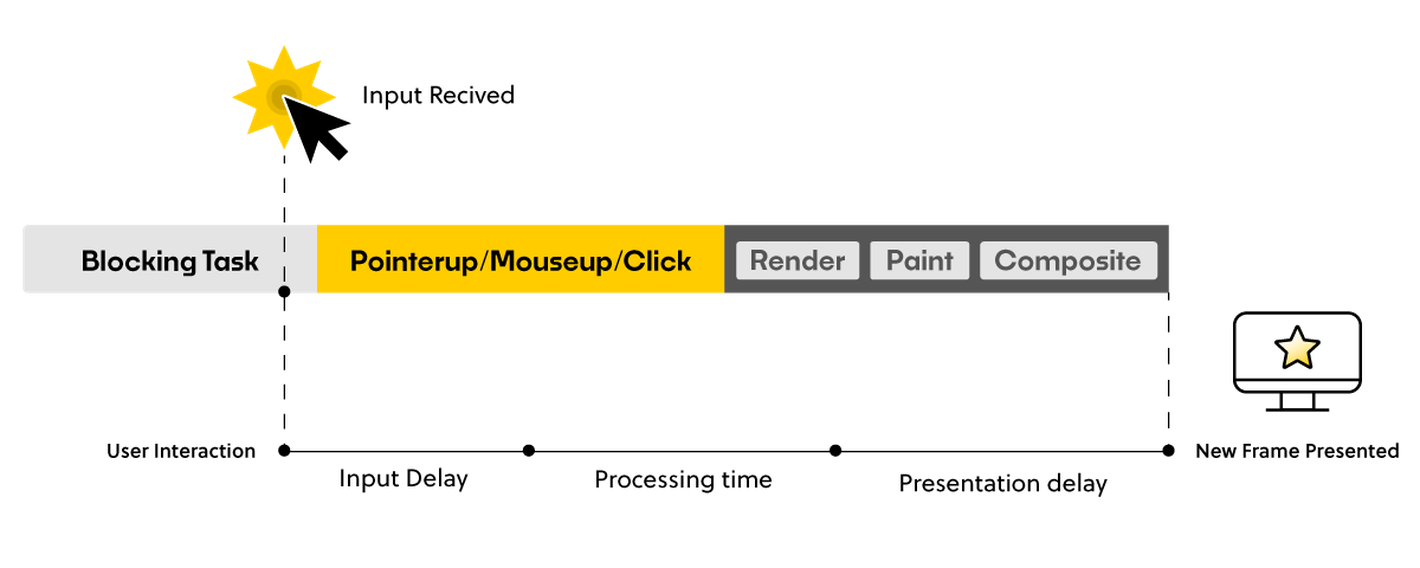
User interaction with a web interface or application includes several key phases that affect how quickly and smoothly the site responds to user actions. Three main phases can be distinguished: Input delay, Processing time, and Presentation delay.
Opóźnienie wejścia (Input Delay)
Opóźnienie wejścia to czas, który upływa od momentu, gdy użytkownik inicjuje interakcję (np. kliknięcie przycisku lub dotknięcie ekranu), do momentu, gdy przeglądarka zaczyna przetwarzać ten sygnał.
Czas przetwarzania (Processing Time)
Czas przetwarzania to okres, w którym przeglądarka przetwarza sygnał wejściowy. Obejmuje to wykonanie wszystkich nasłuchujących zdarzeń, skryptów, a także wszelkie niezbędne obliczenia lub pobieranie danych.
Opóźnienie prezentacji (Presentation Delay)
Opóźnienie prezentacji to czas potrzebny przeglądarce na zaktualizowanie i wyświetlenie zmian na ekranie po przetworzeniu sygnału wejściowego. Po tym kroku użytkownik widzi efekt swojej interakcji.
Common Causes of INP Delays
INP delays can be caused by a variety of factors, including:
Heavy JavaScript scripts. Scripts that take too long to execute can block the browser's main thread, delaying the page's response to interactions.
Resources blocking rendering. Loading large resources such as images, fonts or CSS styles can delay when the browser is ready to repaint the page after an interaction.
Layout and style issues. Complex page layouts and heavy CSS styles can increase the time it takes to refresh the user interface after an interaction.
INP Analysis and Debugging
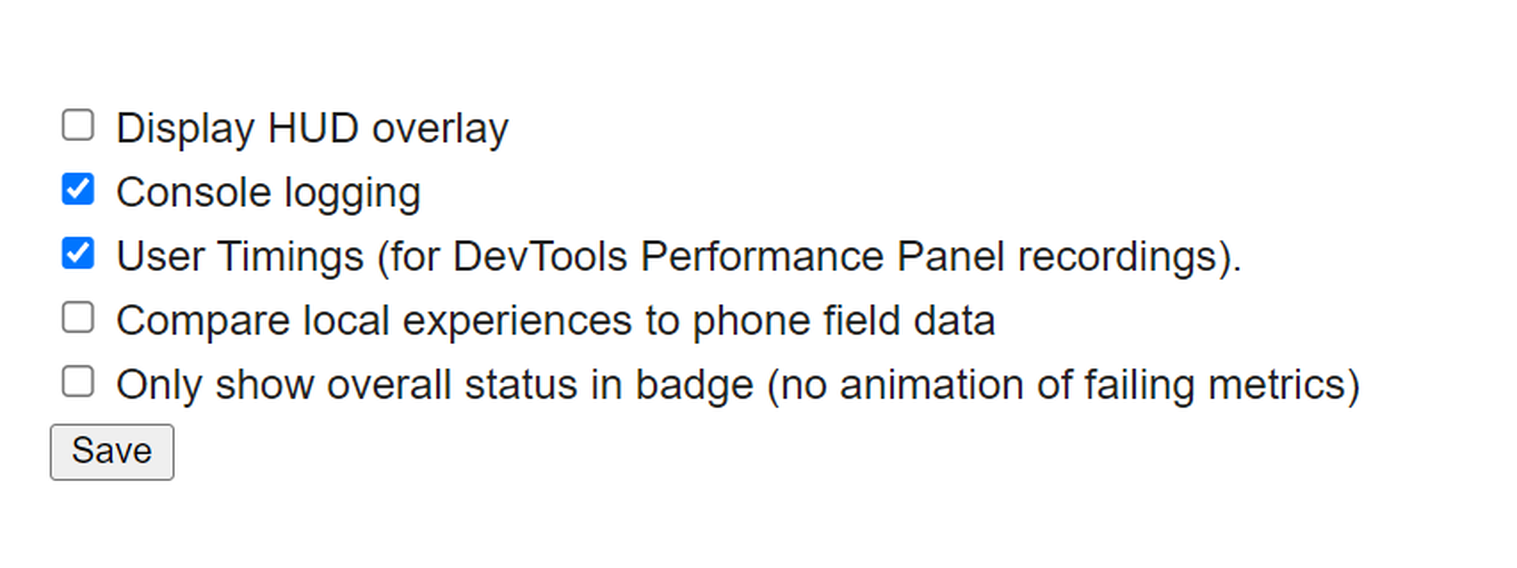
We have received reports from Google Search Console regarding INP issues that need improvement. Therefore, we have selected several sites of this type for more detailed analysis. The measurement of single interaction time (INP) can be accurately performed using an extension for Google Chrome web-vitals. To configure the extension, check the appropriate options in the settings.
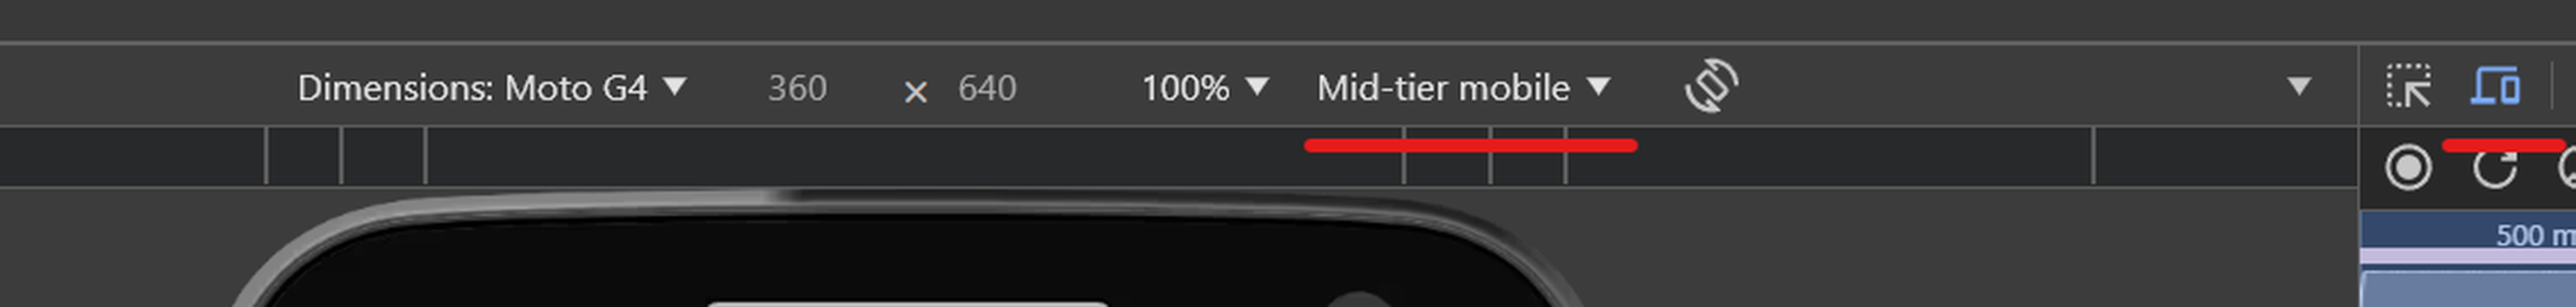
If we are using a fast desktop computer, we may have difficulty reproducing slow and laggy system performance. To emulate a less powerful device, we can turn on CPU limiting in Chrome DevTools:
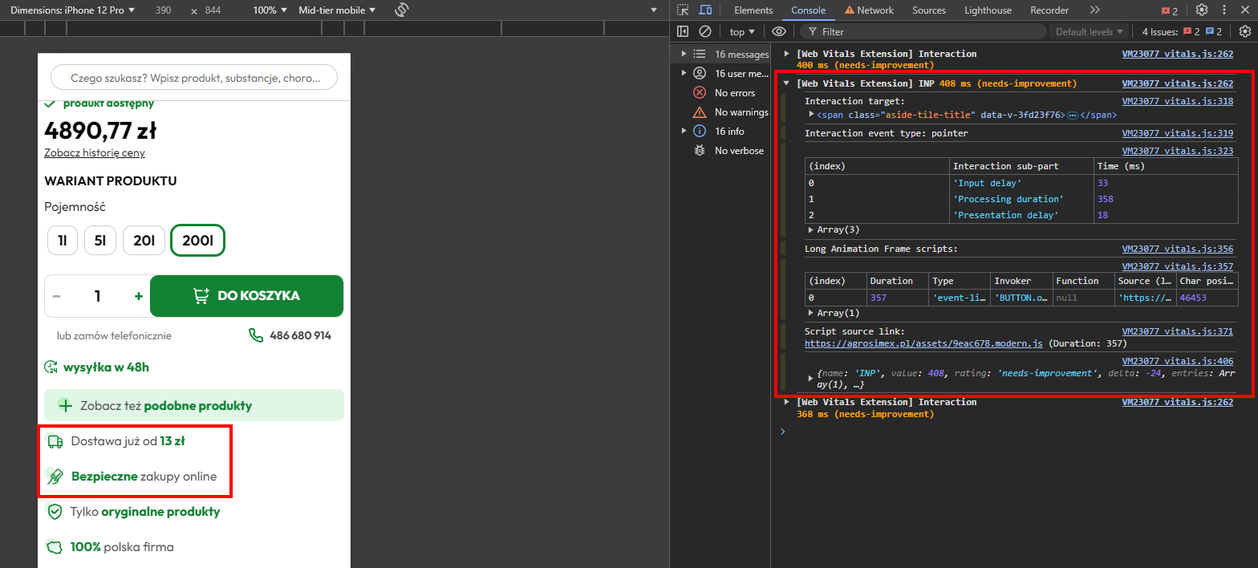
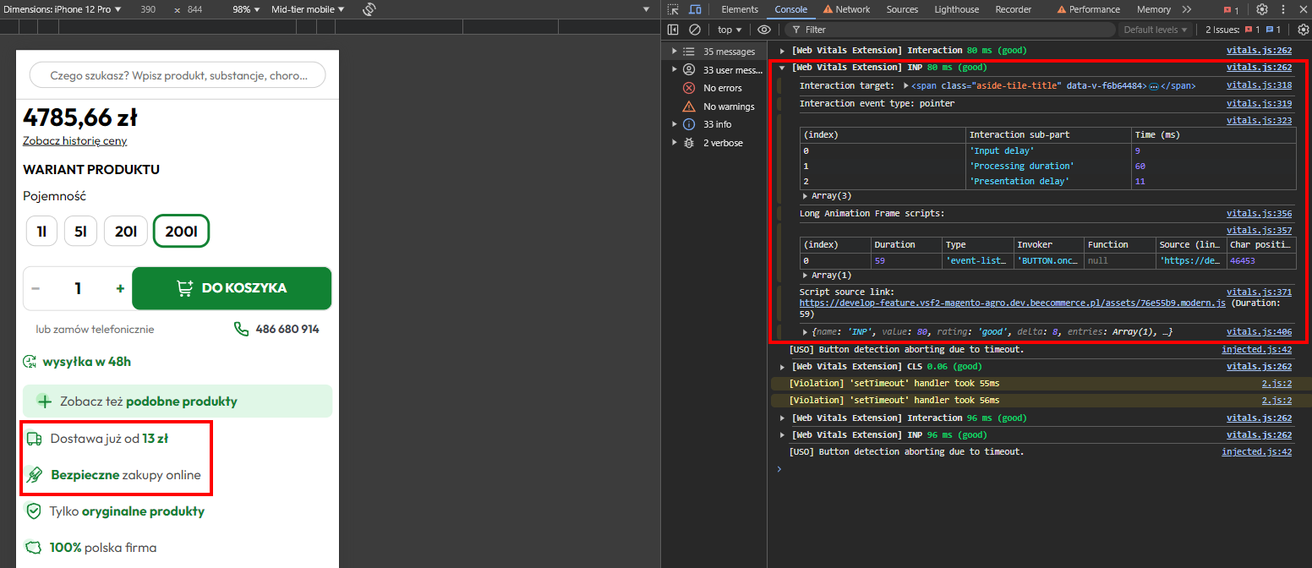
In the screenshot below, you can see the element that caused the worst INP score - these were pop ups with static information. The "processing duration" step took the longest time.
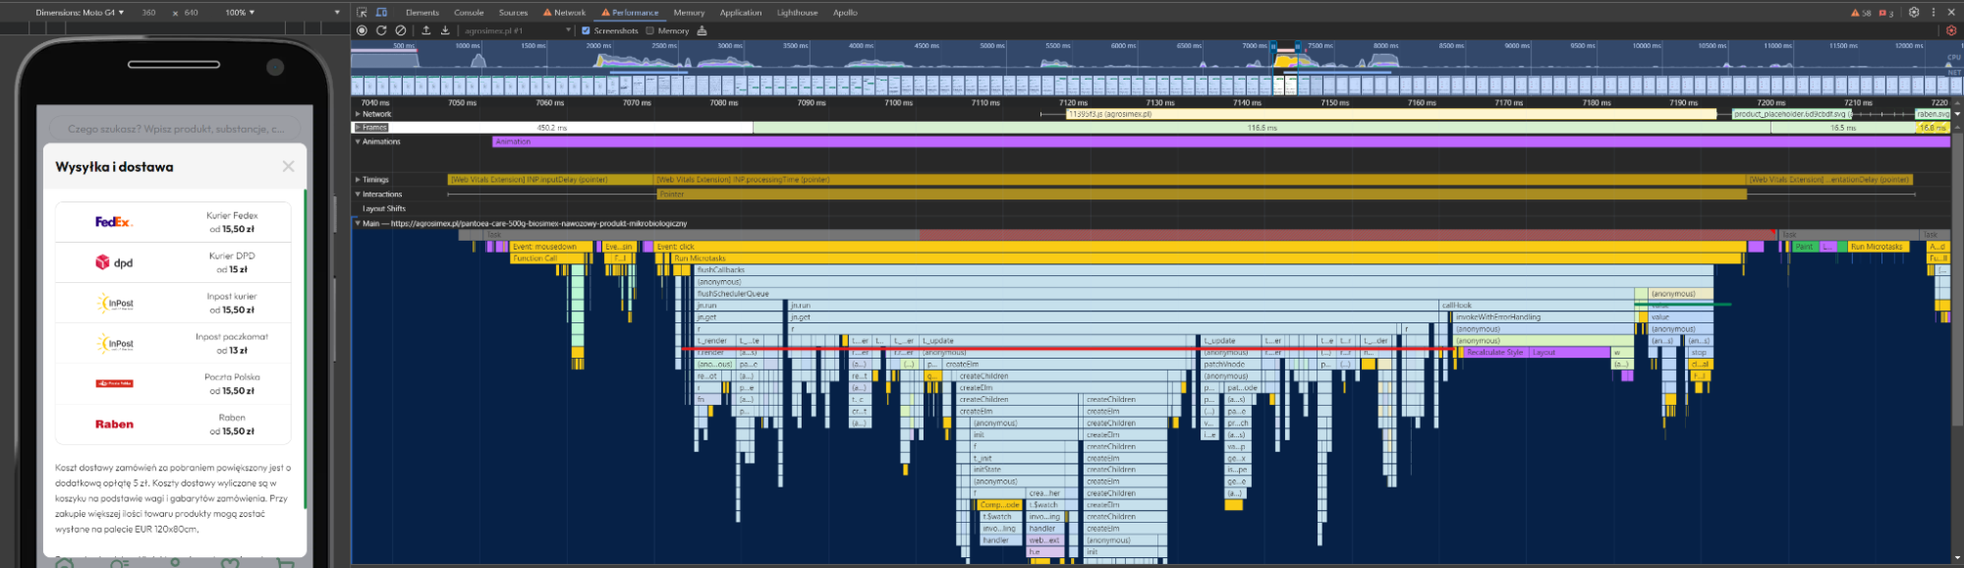
After identifying the problem spots, we moved on to analyzing the causes using the Performance tab in the browser's development tools.

Example
Step 1: Open the developer tools (F12) and go to the Performance tab.
Step 2: Perform a simulation of the user's interaction with the site that Web Vitals reported with a low score.
Step 3: Stop the recording and analyze the graphs, paying particular attention to the long waiting times between events.
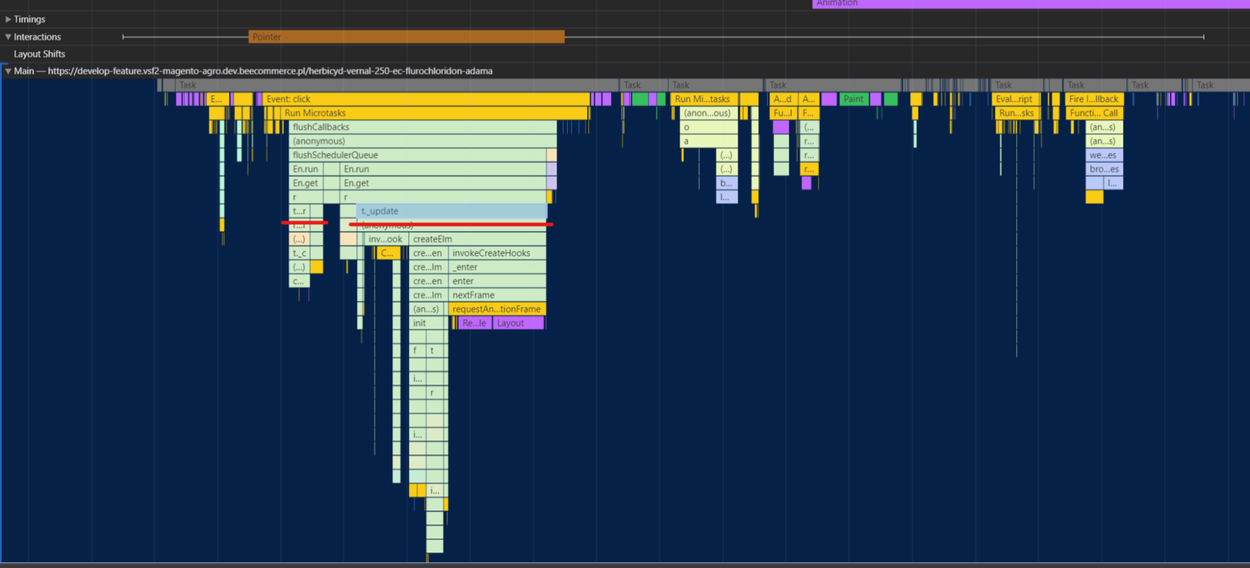
In the following screenshot we see a recording where the user interacted with the site and triggered a popup. The first thing that strikes you is the large number of component updates and calling scripts that are not relevant to this popup.
Searching for the causes of delays
Having identified long delays, it is worth moving on to analyzing their causes. In our case, we identified several key problems:
Large number of updated components
Problem: Popup opened on the page triggers multiple reupdates.
Solution: You can consider using code splitting technique for the modules responsible for the popup. This will get rid of triggering the update of the parent component and all its children. Instead, only the component that will hold the state of the pop up and its children will be updated. Screenshot of the recording in which the above problem was corrected:
Loading unnecessary scripts and libraries
Problem: pPopup to show static data used a library that helped to activate focus on elements with conditional rendering. This functionality is needed if the popup itself contains elements with which you can interact.
Solution: Remove this library, just as a static popup does not need the functionality described above.
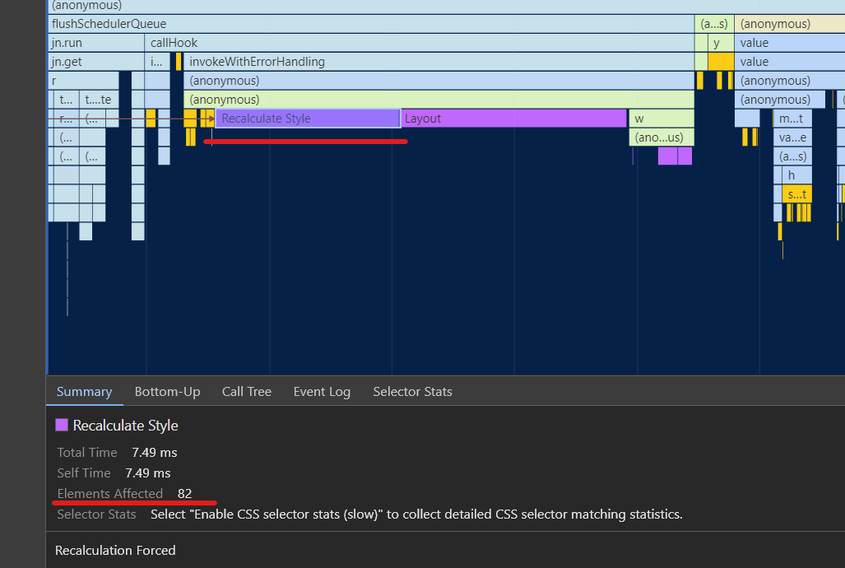
Reduce the size of the DOM
Problem: The DOM contained unnecessary elements that increased the rendering time of the pop up.
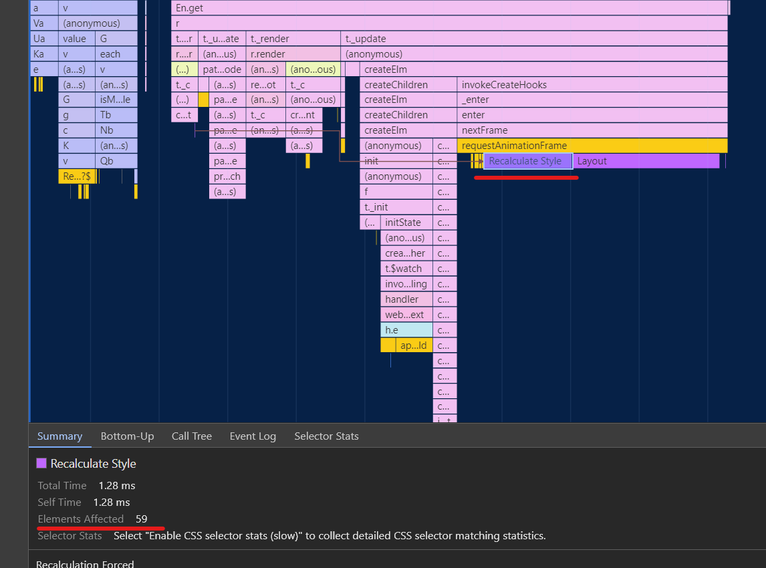
Solution: Simplifying the structure of the DOM, reducing the number of nested elements. The number of elements affected by the interaction decreased from 82 to 59.
Before:
After:
What did we get out of it?
As part of our optimization efforts, we were able to significantly improve the INP rate. Initially, INP averaged 409 ms, but through a series of tweaks we reduced this time to an impressive 80ms.
As we can see, optimizing the INP index requires analyzing various aspects of a site's performance, from resource loading to animation and script performance.
Each case may require a customized approach, so it is a good idea to regularly monitor Web Vitals Indicators and respond to any potential problems.
Listen to our podcast on this subject
Our Experts

Frontend Developer with hands-on experience in Magento and Shopify. One of the few Storyblok implementation specialists in the market. At Beecommerce for 8 years.

Senior Full Stack Developer with 20 years of experience. Expert in PHP, Java, and Python. Certified Magento specialist with 7 years in the platform.
Let's talk about potential areas of collaboration!
Hi!
during the first consultation we'll analyze your goals through the lens of ROI and operational risk. Whether we're building an Enterprise system, an application, or an AI automation — together we'll plan an architecture that eliminates your technical debt and unlocks scalability.


You can find more articles on this topic on our blog

Headless CMS for Marketing 2026: E-commerce Guide
Discover how Headless CMS transforms e-commerce and marketing. A complete guide for store owners and managers, including Storyblok and ROI.
8 min
Read more
When Migrating to Magento Headless Makes Sense? 7 Measurable Criteria in 2026.
When should you migrate to Magento Headless? Discover 7 measurable criteria for 2026 and see if your e-commerce is ready for the switch. Read the article!
10 min
Read more
Headless Commerce for B2B in 2026: Which Features Actually Move the Needle?
Discover the game-changing headless commerce features reshaping the B2B landscape in 2026. Learn how unparalleled flexibility and hyper-personalization can rapidly drive your sales growth. Click through to read the full article and stay ahead of the competition!
8 min
Read more