


BI for e-commerce: profit KPIs vs. vanity metrics in 2026
TL;DR – In brief
Focus on profit metrics like margin, retention, and LTV, rather than vanity metrics (sessions, page views) that don't reflect real value.
Gross and net margin are fundamental – without them, even high sales don't guarantee profitability. Track them at the product, category, and channel level.
BI architecture connects data from multiple sources (ERP, CRM, GA4, PIM) through an ETL process to a central data warehouse for consistent reporting.
Dashboards in tools like Power BI should be designed for executive management to make key decisions in just 5 minutes, focusing on core profit indicators.
A BI implementation is an investment that, for a mid-sized e-commerce business, can see a return within 18-30 months by boosting conversion and optimizing costs.


Business Intelligence for e-commerce: KPIs that truly show profit, not just traffic
If you run an online store, you probably look at sessions, page views, or bounce rates every day. These are useful numbers, but do they show how much profit you're making? We often focus on metrics that look impressive but don't translate directly into profit. Sometimes, we feel the store is "growing," but our bank account doesn't reflect it.
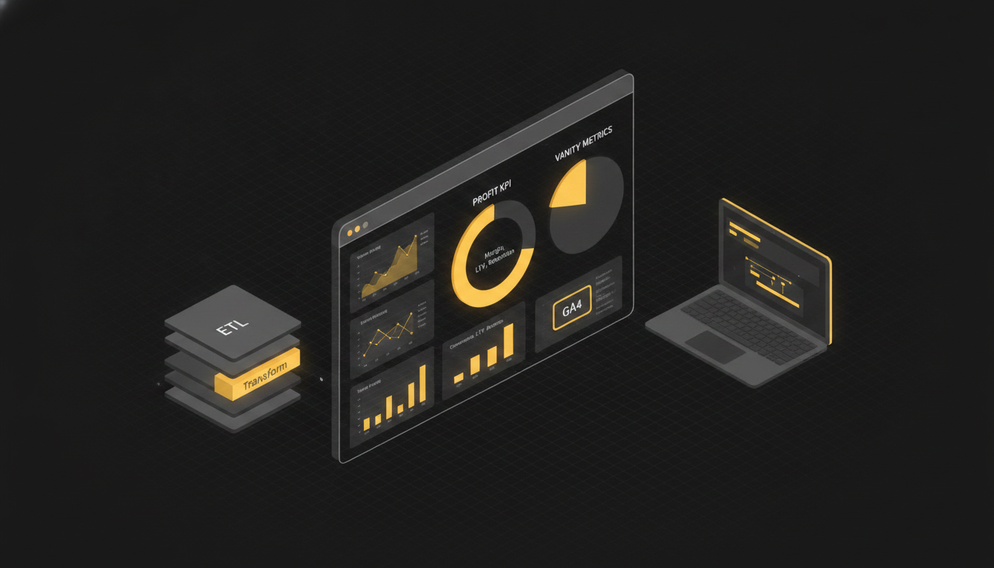
This is where Business Intelligence (BI) becomes essential for e-commerce. It helps you shift from "nice-to-have numbers" to those that actually matter for your business: margin, customer retention, Customer Lifetime Value (LTV), and service costs. The goal is to help you make quick, data-driven decisions that genuinely increase profitability. Instead of guessing what works, you can start measuring it.
The Pitfalls of "Vanity Metrics": Why Sessions Alone Aren't Enough
Many e-commerce owners, and even managers, fall into the "vanity metrics" trap. These are indicators that are easy to track and often look good, but say little about the company's financial health. A high number of sessions or page views might feel encouraging, but what does it matter if nobody's buying, or the margin on products sold is low? What if low-quality traffic is growing while the traffic that actually converts is shrinking? What if a growing share of visits are bots that will never buy? What if visitors only read your blog and have no purchase intent?
Examples of such metrics include:
Sessions and users: High traffic is a good start, but if it doesn't convert, it's a cost, not a profit.
Page views: Users might browse many pages, but are they finding what they're looking for and does it lead to a purchase?
Bounce Rate: A high rate can signal a problem, but a low one doesn't automatically mean success.
These indicators are like a thermometer—they show that something is happening, but they don't explain why or what to do to increase profits. They are useful for a quick diagnosis but insufficient for making strategic decisions.
The table below shows the difference between vanity metrics and those that translate into profit.
| Vanity Metric | Profit Metric | What It Really Measures |
|---|---|---|
| Sessions / Users | Conversion | Traffic effectiveness |
| Page Views | Margin | Transaction profitability |
| Time on Site | Retention | Customer loyalty |
| Bounce Rate | LTV | Long-term customer value |
Key profit indicators: Margin, Retention, LTV, and Cost to Serve
If you want your e-commerce business to be truly profitable, you need to track a different set of indicators—ones that directly impact the financial outcome. We're talking about KPIs that help you manage profitability, build loyalty, and optimize expenses.
Gross and Net Margin: The Foundation of Your E-commerce
This is arguably the most important metric. If you sell a lot but with a low margin, your business might be struggling despite high revenue.
Gross Margin: Sales revenue minus the Cost of Goods Sold (COGS). It shows how much you have left from each product before deducting operating costs.
Net Margin: Gross margin minus all operating expenses (marketing, logistics, salaries, IT). This is your actual profit.
Tracking margin at the product, category, or even sales channel level (e.g. Google Ads vs. Facebook Ads) will show you what's actually generating money. You might discover that a channel with lower traffic but higher margin is more valuable to you, and it's this channel that should be scaled even though it may initially seem more expensive. The same applies to products: if you feed advertising algorithms product-level margin data, Google or Facebook will optimize for your profit, not just sales. Keep in mind that when optimizing for sales value in a situation of negative gross margin, every additional sale is a short-term loss. This can be done, but only if you understand this mechanism and know your customer economics and LTV well
Customer Retention: A Measure of Loyalty and Future Profits
Acquiring a new customer is almost always more expensive than keeping an existing one. Retention measures how many customers return to your store after their first purchase.
Repeat Customer Rate: The percentage of customers who have made more than one purchase.
Purchase Frequency: How often customers make subsequent transactions.

Customer Lifetime Value (LTV): The Long-Term Value of a Relationship
LTV is the total revenue you can expect from a single customer over their entire relationship with your company. It's a key indicator of long-term success.
If your LTV is high, you can afford a higher Customer Acquisition Cost (CAC), knowing that this customer will pay for themselves over time.
LTV analysis helps you segment customers and tailor your marketing strategies more effectively.
Understanding LTV allows you to invest in relationship building, personalization, and loyalty programs that actually pay off.
Customer Acquisition and Service Costs (CAC/CS): Optimize Your Spending
It's not enough to know how much you earn. You also need to know how much it costs you.
CAC (Customer Acquisition Cost): Total marketing and sales costs divided by the number of new customers acquired.
CS (Customer Service Cost): Costs associated with customer service (contact, returns, complaints) per customer.
A low CAC and CS relative to LTV is the goal. It means you are effectively acquiring and serving customers who bring long-term profit.
Recommendation: At BeeCommerce, we specialize in business analytics and designing custom dashboards. We can help you integrate data and visualize these key indicators in tools like Power BI, giving you a complete picture of your business.
Reporting Layer Architecture: From Data to Decisions
To effectively track all these important metrics, you need a solid architecture for collecting, processing, and visualizing data. This isn't a one-time task but a process that requires the right tools and a clear approach.
ETL (Extract, Transform, Load): How Data Gets to the Warehouse
ETL is the process that collects data from various sources, standardizes it, and loads it into a central location for analysis.
Data Sources: Where Does Your Information Come From?
Your e-commerce operation is an ecosystem of multiple systems, and each one generates valuable data:
E-commerce platform: e.g. Magento, Shopify, Medusa.js – data on orders, products, customers. This data is always available via API, and for Open Source solutions, also directly from the database.
ERP system: Information on the cost of goods purchased, stock levels, deliveries. This often also holds HR data useful for calculating second-tier margin.
CRM: Data on customer interactions and communication history. Well-processed CRM data helps you understand not only who your customer is, but also how your sales reps are performing.
Google Analytics 4 (GA4): Site traffic, user behavior, traffic acquisition channels. See what basic parameters GA4 tracks.
PIM (Product Information Management): Detailed product data and attributes. Helps enrich sales data, particularly in assortment-level analysis.
Marketing tools: Campaign data (Google Ads, Facebook Ads, email marketing).
All this data is like pieces of a puzzle. You need a way to bring them together.
ETL (Extract, Transform, Load): How Data Gets to the Warehouse
ETL is the process that collects data from various sources, standardizes it, and loads it into a central location for analysis.
Extract: Pulling data from the source systems.
Transform: Cleaning, formatting, and combining the data. This is a crucial step to ensure consistency and quality.
Load: Transferring the processed data to the data warehouse.
This process is often automated using tools such as Microsoft Dataflows, Stitch Data, Fivetran, or custom Python scripts. You can find more on BI tools in the article BI Tools Worth Investing In.
Data Warehouse: Your Data Hub
This is the central repository where all processed data is stored. Examples include Microsoft Azure Data Lake or Google BigQuery. A data warehouse is optimized for fast execution of analytical queries. Thanks to it, you have a single source of truth for all your reports.
Decision-Making Dashboards: Visualization for Management
The final stage is visualizing the data in the form of interactive dashboards. This is where Power BI comes in handy.
Power BI: Lets you create clear, dynamic reports that help you quickly understand your business situation.
Custom dashboards: Built for your business's specific needs, with an emphasis on key profit indicators.
| Architecture Element | Purpose | Example Technologies |
|---|---|---|
| Data Sources | Collecting raw data | E-commerce platforms (Magento, Shopify), ERP, CRM, GA4, PIM |
| ETL | Standardizing and cleaning data | Microsoft Dataflows, Stitch Data, Fivetran, Python, Power Query |
| Data Warehouse | Storing processed data | Google BigQuery, Snowflake, Azure Data Lake |
| BI Dashboards | Visualization and analysis | Microsoft Power BI, Looker Studio, Tableau |
A report that lets management make a decision in 5 minutes
Imagine having a report in front of you that lets you understand what's happening in your e-commerce business within minutes and make concrete decisions. That's the goal of a well-designed BI dashboard. It's not about showing all the data, but the data that matters most.
Features of such a report:
Clarity and simplicity: Zero unnecessary information. Only what's essential. The perspective is tailored to the audience. Management doesn't need to drop down to a specialist's level of detail, and a specialist doesn't need a bird's-eye view of the whole process — they focus on optimizing their own area.
Translation into action: Every chart or number should prompt the question "What should we do about this?" and "What's driving this?"
Hierarchy: From general to specific. On the first page you see the most important indicators, and only after clicking do you drill down into details.
Visualization: Clear charts, indicators, and colors. Red means a problem, green means success.
Freshness: Data must be current, refreshed at least every 24 hours.
Example structure of a management dashboard:
Main panel (5-minute view):
Net margin (monthly, annual trend)
LTV (average, broken down by customer segment)
CAC vs. LTV (profitability ratio)
Retention rate (monthly, quarterly)
Most and least profitable categories/products
Marketing channel profitability
Detail panels (after clicking):
Margin analysis per product/category
Detailed customer segmentation (e.g. by LTV, purchase frequency)
Breakdown of acquisition and service costs
A dashboard like this gives you an edge. You don't have to spend hours manually pulling data from Excel. Everything is handed to you on a plate, ready for analysis and decision-making. This is true Business-IT Synergy, where technology supports business goals.
Summary: Move From Traffic to Profit
Business Intelligence isn't just a trend — it's a necessity for anyone serious about growing their e-commerce business. Moving from tracking vanity metrics to analyzing profit indicators like margin, retention, and LTV is the foundation of sustainable growth.
Building a solid reporting architecture — from data sources, through the ETL process, to interactive Power BI dashboards — lets you make fast, accurate decisions. Remember: information is power, but only when it's well organized and easy to understand.
FAQ
Vanity metrics are indicators that look impressive but don't directly translate into profit. Examples include the number of sessions, page views, or social media likes — which don't necessarily represent real business value.
Key profit indicators are gross and net margin, customer retention, Customer Lifetime Value (LTV), and customer acquisition and service cost (CAC/CS). These metrics show real profitability and customer loyalty.
High revenue with low margin means your business may be generating a lot of sales but very little profit. Margin shows how much you actually keep after covering costs, which is key to the company's financial health.
LTV is the total revenue you can expect from a single customer over the entire duration of their relationship with your company. A high LTV means customers are loyal and generate long-term profit, justifying higher investment in acquiring them.
A BI architecture consists of data sources (e.g. ERP, CRM, GA4), the ETL (Extract, Transform, Load) process to standardize data, a data warehouse to store it, and visualization and analysis tools such as Power BI, which build dashboards.
Yes, Power BI is one of the leading Business Intelligence tools. It enables the creation of interactive, clear, and dynamic dashboards that visualize key indicators and support fast business decision-making.
Implementation time depends on the scale and complexity of the business. For a mid-sized e-commerce operation, the analysis phase and building the first working module (MVP) can take 2–4 months, with a full rollout taking 6–12 months. It's important to phase the project so you see initial results quickly.
Yes, even small companies can gain enormous benefits from BI. Understanding key profit indicators from the very start allows for more effective budget management, strategy optimization, and faster growth.
Sources
Microsoft Power BI Official Documentation (Microsoft, 2024) — <https://learn.microsoft.com/en-us/power-bi/>
Google Analytics 4 Help Center (Google, 2024) — <https://support.google.com/analytics/>
"The State of Business Intelligence 2023" (Statista, 2023) — <https://www.statista.com/statistics/1325785/business-intelligence-market-size-worldwide/>
"Customer Lifetime Value (CLV): The Ultimate Guide" (HubSpot, 2024) — <https://blog.hubspot.com/service/what-is-clv>
"Why Customer Retention Is the New Acquisition" (Forbes, 2023) — <https://www.forbes.com/sites/forbesagencycouncil/2023/07/20/why-customer-retention-is-the-new-acquisition/>


Honne Discovery Call — 30 minutes with our expert.
No presentations, no pitch decks. We talk about your business goals, what's holding you back, and whether starting the project is even worth it. Sometimes our best recommendation is "don't do this" and save money.


You can find more articles on this topic on our blog

AI in field sales: how an AI assistant is reshaping the Rep's job and company results in 2026
Discover how an AI sales assistant automates reporting, optimizes routes, and boosts sales efficiency. Stop spending evenings updating your CRM.
10 min
Read more

Clickable prototype over a 50-page spec in e-commerce
Why a clickable backoffice mockup speeds up board decisions in e-commerce projects and cuts implementation risk. A practical guide.
9 min
Read more
Seamless store migration: how to plan your cutover and mitigate risk
Planning an e-commerce store migration? Learn how to choose a cutover strategy (big-bang vs. strangler), minimize downtime, and monitor the first 72 hours post-launch to protect your sales and rankings.
12 min
Read more